
How does perception of brand authenticity affect ad performance?
What is authenticity? When we talk about authenticity, we're diving into what makes something real. It's about being genuine and connecting with people on a deeper, more meaningful level. It means being true to oneself by doing what is promised, being open and transparent, and acting according to one’s values. This is true for people, but also for brands.
Imagine a brand as a person—it needs to keep promises, show its true colors, and act on real values to truly connect. It's this essence of authenticity that can make a brand stand out in the crowded marketplace of ideas. For brands seeking to resonate with consumers, being seen as authentic is vital for creating trust and loyalty.
Why brand authenticity matters
In the United States, television advertising spending is estimated to be between $60-65 billion per year. Single events, like the Super Bowl, cost $7 million for a 30-second spot. That's why it's imperative that commercial spots yield results for a brand’s targeted segment. But what happens when a brand is judged as inauthentic? And are brands viewed more favorably by those who see them as authentic?
For this blog post's study, we partnered with marketing research company Breakthrough Research to test how people reacted to different commercials. Our respondents were people who rated the brands as either high or low in authenticity.

How to measure perceived authenticity
Breakthrough Research created a new proprietary Authenticity measure to assess the genuineness of brands. Their Authenticity measure leverages embodied cognition to have respondents pull statements they find to be "true to the brand" closer together or drag statements they find to be "contradictory to the brand" further apart.
We combined the scores and transformed the distances between statements to a brand authenticity score. Next, we created authenticity scores based on a 5-point scale, where the top two points were High Authenticity scores and the bottom three points were Low Authenticity scores.
Measuring facial expressions during the ads
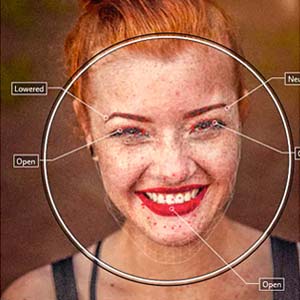
In addition, we used facial expression analysis to measure respondents’ reactions while watching the ads. The software we used, FaceReader 9.1, is built on a Deep Face Model and captures expressions in a reliable, quantitative way. It measures facial expressions and twenty different facial muscles known as Action Units (AUs). These AUs can be combined to create custom expressions, such as confusion, laughing, and smiling.
One hundred and thirty-two respondents watched one of two ads for either Progressive Insurance or Amazon. Progressive features a group of parody ads whereby a doctor, Dr. Rick, teaches new homeowners who are “becoming their parents”, that is, becoming technologically or socially inept. The Amazon ad features a heartfelt story about a man changing careers.
Respondents watched the ads at their own leisure, for example, at home. Their facial expressions were recorded via webcam and FaceReader Online.
Psychographic segmentation with FaceReader
Sixty respondents viewed the Progressive ad “Social Listening” whereas seventy-two respondents viewed the Amazon ad “Gourmet Guard”. There were similar levels of attention and interest between groups. Moreover, all respondents showed similar levels of attention and interest throughout the ads. We determined these using custom expressions in FaceReader 9.1. We also used FaceReader to segment respondents based on brand authenticity score. For both ads, we created a High Authenticity and a Low Authenticity group.
We hypothesized that respondents who rated a brand as highly authentic would view ads more favorably than those who rated the brand with a low authenticity score.
Expressions were more positive with higher perceived authenticity
Indeed, with the Progressive ads, the High Authenticity group laughed more frequently and with higher intensity than did the Low Authenticity group. Laughing moments occurred when Dr. Rick taught the group and not when he spoke directly to the camera. The Low Authenticity group did laugh at some of the same moments, but only a few and with minimal intensity. Curiously, this group displayed higher amounts of confusion, so it is possible that this group didn’t understand the in-jokes, that it was a parody, or possibly the point of the ad.
Amazon’s ad did not feature parody or in-jokes. Therefore, it did not have periods of laughter. Instead, this ad focuses on the transformation of a security guard as he upgrades his lunch, then his skills, ultimately leading him to apply for a job as a chef. Accordingly, the High Authenticity group smiled progressively as the man transitioned from guard to chef. The Low Authenticity group, however, showed minimal periods of smiles, but increased amounts of confusion from start to finish.
You may also like this blog series about consumer experience while self-designing a product:
- Just the way I want it: a study on consumer experience in self-designing
- Design your own product: consumer experience and abandonment behavior
- From start to finish: decreasing abandonment when self-designing a product
Facial expressions and psychographic segmentation generate greater insights
There are two important findings from this study. First, the perception of a brand’s authenticity affects how individuals react to that brand’s advertising. Brands high in authenticity tend to produce more positive emotions (such as laughs and smiles), whereas brands low in authenticity tend to elicit a flatter affect and more confusion. Second, this study demonstrates how custom expressions in FaceReader can generate insights beyond the basic expressions - including attention, interest, laughing, and confusion.
Furthermore, when you gather facial expression data in a respondent’s preferred environment, paired with psychographic segmentation, you understand your respondents much better compared to surveys or expression analysis alone. Taken together, these data demonstrate the capacity and flexibility of custom expressions in FaceReader, especially when combined with ad testing using FaceReader Online.
You can also find this article in the Neuromarketing Yearbook 2024, preorder it here!
References
- https://www.statista.com/statistics/217134/total-advertisement-revenue-of-super-bowls/
- https://www.visualcapitalist.com/top-tv-advertising-spenders
- https://bthrough.com/
- Conference: Trend Lens: How To Build (And Measure) An Authentic Brand, TMRE2023, Denver, CO
- https://www.progressive.com/commercials-campaigns/dr-rick/
- https://www.aboutamazon.com/news/retail/amazon-prime-commercial-security-guard-chef
Get the latest blog posts delivered to your inbox - every 15th of the month

more

Observations of eating behavior
Our eating behavior has a strong connection with our weight and can thus influence the development of obesity. Obesity (having too much body fat) is a subject under discussion amongst many scholars.
Marketing and market research blogs
Learn all about gamification in marketing, facial expression analysis, and the difference between self-report, qualitative research, and unobtrusive observations.